Are you drowning in spreadsheets, trying to make sense of endless rows of employee data? You’re not alone. For HR professionals, analyzing and interpreting vast amounts of data is a daily challenge. But what if I told you there’s a tool that can transform this tedious task into a breeze, saving you hours of work? Enter PivotTables.
The Time-Saving Miracle for HR Data Analysis
Imagine this: It’s the end of the month, and your manager asks for a detailed report on employee attendance, performance, and payroll. The clock is ticking, and you’re staring at a massive Excel sheet. Feeling overwhelmed? That’s where PivotTables come in.
PivotTables are a powerful feature in Excel that allows you to quickly summarize and analyze large datasets. They can turn a complex maze of numbers into clear, concise, and actionable insights. Let’s dive into how PivotTables can revolutionize your employee data analysis process.
The Problem: Data Overload
HR professionals deal with various types of data—from employee attendance to performance metrics and payroll information. Manually sifting through this data can be time-consuming and prone to errors. The traditional method of filtering, sorting, and calculating data is not only inefficient but also stressful.
The Solution: PivotTables to the Rescue
- Easy Setup and Customization: Creating a PivotTable is as simple as a few clicks. Select your data range, insert a PivotTable, and voila! You can customize it to show exactly what you need. Whether it’s summarizing attendance records, analyzing performance trends, or comparing payroll data, PivotTables make it effortless.
- Dynamic Data Analysis: PivotTables allow you to dynamically change your data view. Need to see the performance metrics by department? Or compare attendance rates month-over-month? With PivotTables, you can pivot (hence the name) your data around various axes, giving you a fresh perspective with each adjustment.
- Interactive Reporting: Say goodbye to static reports. PivotTables let you create interactive reports that update automatically when your data changes. This means your HR reports are always up-to-date without the need for constant manual updates.
- Error Reduction: Manual data analysis increases the risk of errors. PivotTables reduce this risk by automating calculations and data summaries. This not only ensures accuracy but also boosts your confidence in the reports you generate.
Handling Objections: “Is It Really That Simple?”
You might be thinking, “This sounds great, but I’m not a data whiz. Can I really do this?” Absolutely! PivotTables are designed to be user-friendly, even for those who are not Excel experts. There are plenty of online tutorials, guides, and even in-built Excel prompts to help you get started.
Open Loops: Teasing Advanced Techniques
Ready to take your data analysis to the next level? In our next articles, we’ll explore advanced PivotTable techniques that will further streamline your workflow, including integrating PivotTables with Power Query and creating visually appealing dashboards. Stay tuned to unlock even more potential!
Step-by-Step Guide: Creating Your First PivotTable
Let’s walk through creating a basic PivotTable to get you started on this time-saving journey.
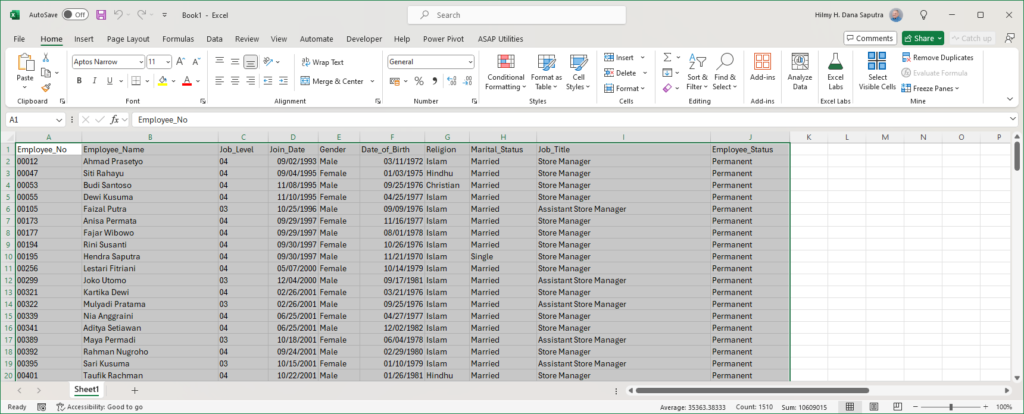
Step 1: Select Your Data
Highlight the range of data you want to analyze. Ensure your data is well-organized, with headers for each column.
Step 2: Insert a PivotTable
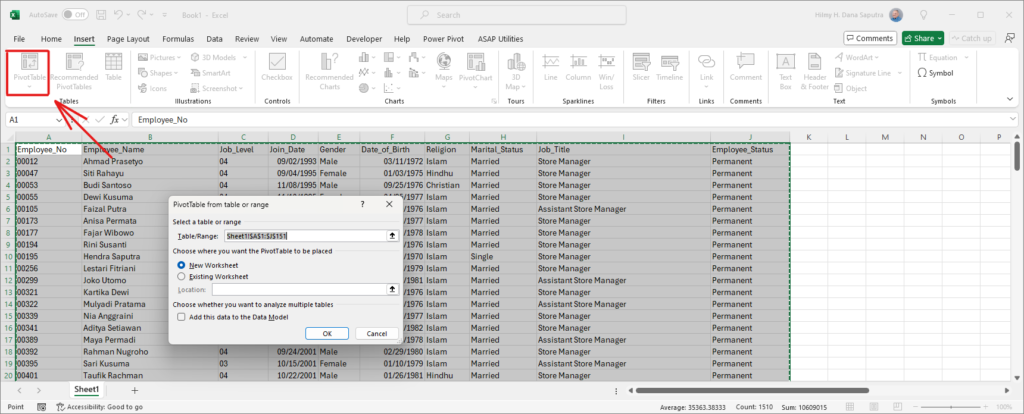
Go to the ‘Insert’ tab in Excel and click on ‘PivotTable.’ A dialog box will appear. Choose whether to place the PivotTable in a new worksheet or an existing one.
Step 3: Choose Your Fields
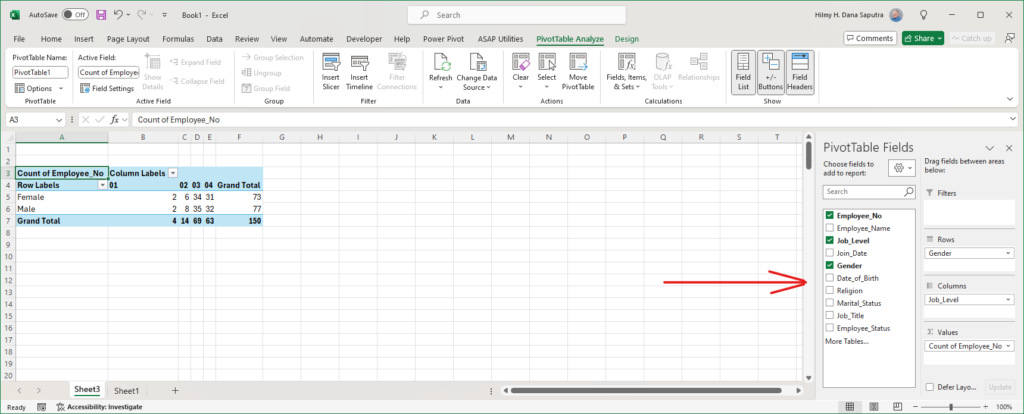
In the PivotTable Field List, drag and drop fields into the Rows, Columns, Values, and Filters areas. For example, drag ‘Gender’ to Rows, ‘Job_Level’ to Columns and ‘Employee_No’ to Values.
Step 4: Customize and Analyze
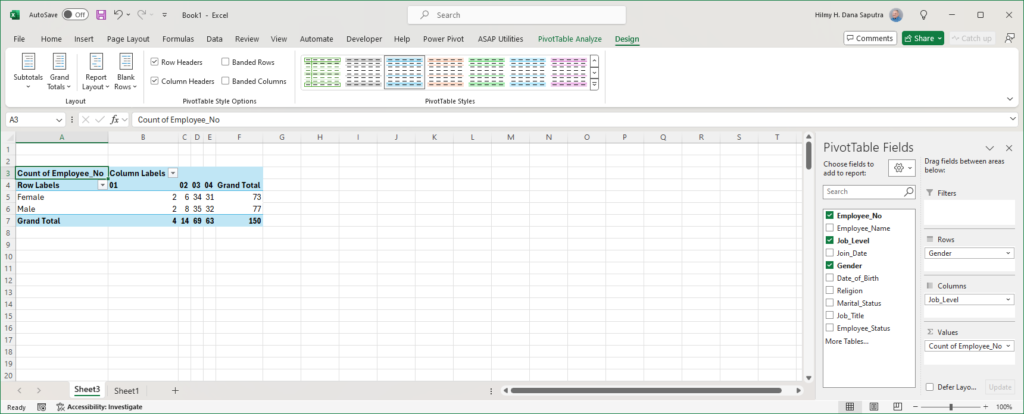
Use the PivotTable tools to customize your table. You can sort, filter, and format your data to get the insights you need. Play around with different configurations to see various aspects of your data.
Conclusion: Transform Your HR Data Management
PivotTables are more than just a feature in Excel; they are a game-changer for HR professionals. By automating and simplifying data analysis, PivotTables free up your time, allowing you to focus on what truly matters—strategic decision-making and supporting your team. So, why not give PivotTables a try and revolutionize the way you handle employee data? You’ll wonder how you ever managed without them.
Remember, the next time you’re faced with a daunting spreadsheet, PivotTables are your secret weapon to save time and enhance accuracy. Happy analyzing!




Leave a Reply