Ever feel like you’re sitting on a goldmine of HR data, but struggling to extract the valuable insights buried beneath the surface? Stacks of spreadsheets can be overwhelming, leaving you with more questions than answers. But fear not, HR superheroes! Excel has a secret weapon in its arsenal: powerful functions that can transform your data from a tangled mess into a crystal-clear picture of your workforce.
Let’s face it, traditional data analysis in Excel can be time-consuming and prone to errors. Imagine manually counting employee turnover rates or sifting through endless rows to identify specific skill sets. Yikes! But with the magic of SUMIF, COUNTIFS, VLOOKUP, and PivotTables, you can unlock the hidden potential of your HR data and make informed decisions that drive real impact for your organization.
Objection Ahoy! “Excel functions sound complicated, I’m not a math whiz!”
Here’s the good news: mastering these functions doesn’t require a Ph.D. in Excel-ese. We’ll break them down into easy-to-understand steps, so even Excel newbies can become data analysis rock stars!
Ready to take the plunge? Let’s dive into our treasure chest of Excel functions!
1. SUMIF: Your One-Stop Shop for Conditional Sums
Imagine you have a spreadsheet filled with employee salaries. You want to know the total compensation for a specific department. Sure, you could add up each cell manually, but why waste time when SUMIF can do the heavy lifting for you?
Here’s the magic formula:
=SUMIF(range, criteria, sum_range)- Range: This is where you specify the data you want to analyze (e.g., the entire salary column).
- Criteria: This is the condition you want to meet (e.g., “Marketing” if you want to sum salaries in the Marketing department).
- Sum_range (optional): If your salaries are in a different column, specify the range of cells containing those values here.
With SUMIF, you can answer questions like:
- What’s the total budget for employee training? (Criteria: “Training” in the expense category)
- What’s the average salary for employees with a specific skill set? (Combine SUMIF with AVERAGE for even deeper insights!)
2. COUNTIFS: Counting Like a Pro (Because Regular Counting is So Last Season!)
Need to track the number of employees who meet multiple criteria? COUNTIFS is your best friend!
Here’s the formula:
=COUNTIFS(criteria_range1, criteria1, criteria_range2, criteria2, ...)- Criteria_range & Criteria: You can specify multiple criteria for different columns. For example, you could count the number of employees who are in the “Sales” department AND have over 5 years of experience.
Pro Tip: Use quotation marks for text criteria and numbers for numerical criteria.
With COUNTIFS, you can answer questions like:
- How many employees are on probation and in the Engineering department?
- How many open positions do we have in specific locations?
3. VLOOKUP: The Data Detective – Find What You Need, Fast!
Ever spent ages searching for specific information in a massive spreadsheet? VLOOKUP is your knight in shining armor!
Here’s the formula:
=VLOOKUP(lookup_value, table_array, col_index_num, [is_sorted])- Lookup_value: The value you want to find (e.g., an employee ID).
- Table_array: The range of cells containing the data you want to search (e.g., your employee database).
- Col_index_num: The column number in the table_array that contains the information you want to retrieve (e.g., the column with employee names).
- [is_sorted] (optional): Enter TRUE if your data table is sorted in ascending order.
Pro Tip: Always use TRUE for is_sorted unless you’re absolutely sure your data isn’t sorted.
With VLOOKUP, you can answer questions like:
- What’s the department head for a specific employee (using their ID)?
- What are the salaries for employees with a specific job title (using the title as the lookup value)?
4. PivotTables: The Ultimate Data Visualization Powerhouse
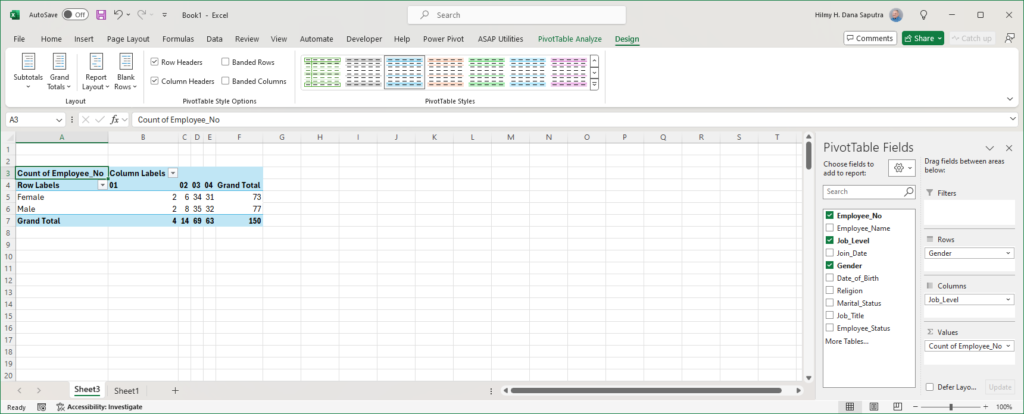
Imagine transforming your complex HR data into a clear, interactive report with just a few clicks. That’s the magic of PivotTables!
Here’s a simplified breakdown: you select your data range, choose the fields you want to analyze (rows, columns, and values), and voila! PivotTables do the rest.

Here’s the beauty of PivotTables:
- Effortless Analysis: PivotTables allow you to easily switch between different views of your data, helping you identify trends and patterns that might be hidden in a traditional spreadsheet.
- Interactive Insights: You can sort, filter, and drill down into your data with just a few clicks, making it easy to explore specific details.
- Visual Storytelling: PivotTables can be used to create charts and graphs, making your data more visually appealing and easier to understand for everyone in your organization.
With PivotTables, you can answer questions like:
- What are the top reasons for employee turnover by department? (Analyze data by department and reason for leaving)
- Where are the skills gaps in our workforce? (Cross-tabulate skills against departments)
- How does employee performance correlate with years of experience? (Create a scatter plot using PivotTable data)
The Power of Combining Forces
The true magic happens when you combine these functions. Imagine using SUMIF to calculate average salaries within departments identified through a PivotTable. Or using VLOOKUP to retrieve specific employee data and then analyzing it in a PivotTable for deeper insights. The possibilities are endless!
Ready to Unlock the Power of Your HR Data?
By mastering these essential Excel functions, you can transform your HR data from a source of frustration to a treasure trove of insights. You’ll be able to make data-driven decisions that improve your HR processes, support strategic initiatives, and ultimately, help your organization thrive.
So, what are you waiting for? Grab your keyboard, open Excel, and unleash the power of your data!
Bonus Tip: Don’t be afraid to experiment! There are countless resources available online to help you learn more about Excel functions and explore different applications. With a little practice, you’ll be a data analysis pro in no time!


Leave a Reply